日志
matlab 表达电场特性
||
1.网上找到一段脚本
[x,y]=meshgrid(-2:0.1:2,-2:0.1:2);
[x,y]=meshgrid(-2:0.1:2,-2:0.1:2);
z=1./sqrt((x-1).^2+y.^2+0.01)+1./sqrt((x+1).^2+y.^2+0.01); %此处加0.01的原因是不能让分母为0

[dx,dy]=gradient(z);
contour(x,y,z,12);
hold on;
quiver(x,y,dx,dy);
xx=[linspace(-2,2,10),2*linspace(1,1,10),linspace(-2,2,10),-2*linspace(1,1,10),.01*linspace(1,1,10),-.01*linspace(1,1,10)];
yy=[2*linspace(1,1,10),linspace(-2,2,10),-2*linspace(1,1,10),linspace(-2,2,10),linspace(-2,2,10),linspace(-2,2,10)];
streamline(x,y,dx,dy,xx,yy)
2.复制到matlab运行得到以下图形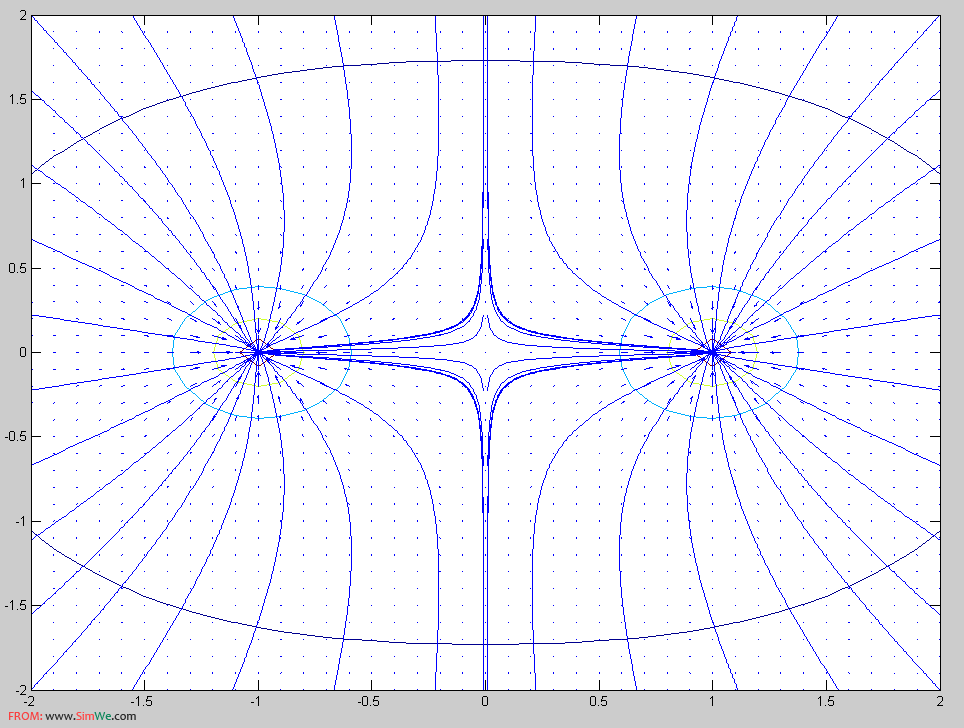
2.了解各部分函数.
2.1
meshgrid
Generate X and Y arrays for 3-D plots
Syntax
[X,Y] = meshgrid(x,y)
[X,Y] = meshgrid(x)
[X,Y,Z] = meshgrid(x,y,z)
Description
[X,Y] = meshgrid(x,y) transforms the domain specified by vectors x and y into arrays X and Y, which can be used to evaluate functions of two variables and three-dimensional mesh/surface plots. The rows of the output array X are copies of the vector x; columns of the output array Y are copies of the vector y.
[X,Y] = meshgrid(x) is the same as [X,Y] = meshgrid(x,x).
[X,Y,Z] = meshgrid(x,y,z) produces three-dimensional arrays used to evaluate functions of three variables and three-dimensional volumetric plots.
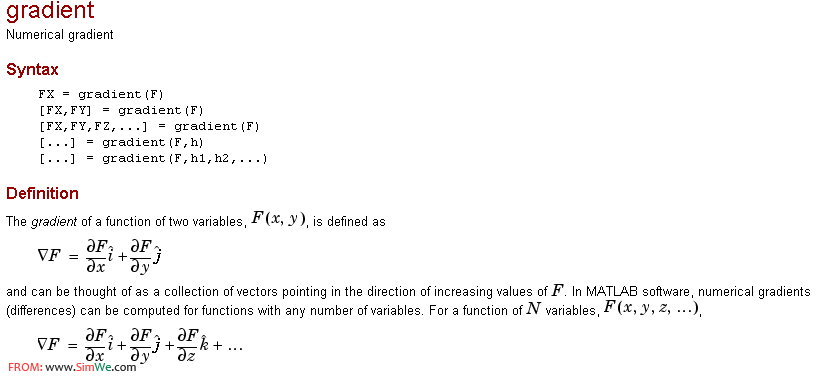
2.2 gradient
2.3 linspace
3.表达变换
hold on;
x=-2:0.05:2;
y=-2:0.05:2;
[X,Y]=meshgrid(x,y);
Z1=1./sqrt((X-1).^2+Y.^2+0.01);
Z2=1./sqrt((X+1).^2+Y.^2+0.01);
Z=Z1+Z2;
%surf(X,Y,Z)
[dx,dy]=gradient(Z);
contour(X,Y,Z,12);
quiver(X,Y,dx,dy);
[imgid=0]